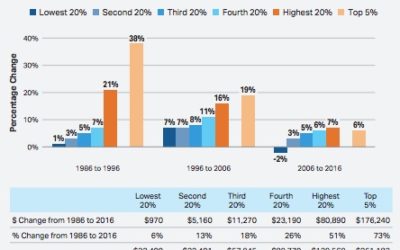
Occasionally a news report is so strong that we agree to publish it in its entirety. The work by the College Board is one such report so please consider the data carefully. All college parents and families will benefit from the insights from the annual Trends in Higher Education report by the College Board. The summary contained below and particularly Figure 17A illustrates the difficulty facing families who are expected an ever larger part of a higher cost of college. The capacity of families to contribute to an ever-growing cost of college is a pressing matter that is seen best in the context of general wage stagnation contained in the chart below.
 College Board, October 25, 2017 (news release):
NEW YORK — The College Board’s 2017 Trends in Higher Education reports released their Trends in Student Aid and Trends in College Pricing—show continuing moderate annual increases in published tuition and fee prices, ranging from 2.9% to 3.6% across the public and private nonprofit sectors of higher education. In 2017-18, the average published tuition and fee prices are $3,570, $9,970, and $34,740 at public two-year, public four-year, and private nonprofit four-year sectors, respectively.
For the past five years, Trends in College Pricing has reported one-year price increases of about 3% each year in the public four-year sector (before adjusting for inflation)—a steep decline from the one-year price increases of between 6% and 13% during the decade from 2001-02 to 2011-12. Patterns in the public two-year and private nonprofit four-year sectors are similar but less pronounced.
In 2017-18, full-time students in the public and private nonprofit four-year sectors receive an estimated average of $5,830 and $20,210, respectively, in grant aid and tax benefits, covering nearly 60% of tuition and fees in each sector. On average, grant aid and tax benefits cover tuition and fees for full-time students at public two-year colleges. However, net prices in all three sectors continued to rise between 2016-17 and 2017-18, even after adjusting for inflation. While the average net prices in 2017-18 remain lower than they were in 2007-08 at public two-year and private nonprofit four-year institutions, net prices have risen in all three sectors each year since 2011-12, as the growth in grant aid slowed relative to the growth in tuition and fees.
“The increases in the net prices students pay raise particular concerns for low- and moderate-income students,” said Jennifer Ma, coauthor and senior policy research scientist at the College Board. “Even when, as is often the case, these students receive enough grant aid to cover their tuition and fees, they frequently struggle to pay for their living expenses while in college.” In 2016-17, postsecondary students received a total of $125.4 billion in grant aid to help pay for undergraduate and graduate education—74% more (in inflation-adjusted dollars) than a decade earlier. Even with an 11% increase in full-time equivalent (FTE) enrollment over 10 years, the $8,440 in grant aid per undergraduate was 61% higher and the $9,290 per graduate student was 39% higher than a decade earlier.
The federal share of total grant aid peaked at 44% in 2010-11 and declined to 32% in 2016-17, while the share of institutional grant aid increased from 35% in 2010-11 to 47% in 2016-17. The composition of federal grant aid has also changed. Between 2006-07 and 2016-17, Pell Grants increased from $15.2 billion (in 2016 dollars) to $26.6 billion, but fell from 76% to 66% of federal grants; veterans’ benefits, which rose from $3.2 billion to $12.9 billion, grew from 16% of federal grants in 2006-07 to 32% in 2016-17.
Total annual education borrowing declined in 2016-17 for the sixth consecutive year, falling by 15%, from $125.6 billion (in 2016 dollars) in 2010-11 to $106.5 billion in 2016-17. Borrowing per FTE undergraduate fell from $6,260 in 2010-11 to $5,430 in 2016-17. Borrowing per FTE graduate student declined from $19,420 in 2010-11 to $17,760 in 2014-15, but increased to $18,430 in 2016-17.
“The tuition price increases for 2017-18 tell a small part of the story of how much and with what resources students pay for college. The Trends reports highlight long-term changes, showing how annual price increases have compounded over time,” said Sandy Baum, co-author and fellow in the education policy program at the Urban Institute. “When grant aid was growing rapidly, many students were protected from the price increases, but as the growth in federal and state grant aid has slowed, the average net prices students pay are rising.”
“Ensuring that the nation has access to accurate and timely information on trends in college prices and student aid is a key part of the College Board’s mission to promote excellence, transparency, and equity in postsecondary education opportunity for students of all backgrounds,” said Jessica Howell, the College Board’s vice president of research. “We’re proud to continue our role in helping to inform the conversation about financing college through the release of the Trends reports.”
Key College Pricing Findings
- Average published tuition and fees for full-time in-state students at public four-year colleges and universities increased by 3.1% before adjusting for inflation, from $9,670 in 2016-17 to $9,970 in 2017-18.
- In 2014-15, at public four-year institutions, federal aid recipients (including those who received only federal loans) with incomes $30,000 and below paid no tuition on average, and had $2,700 of grant aid to put toward an estimated $14,520 in non-tuition expenses, leaving $11,820 for them to cover out of other resources.
- Average published tuition and fees for full-time out-of-state students at public four-year colleges and universities increased by 3.2% before adjusting for inflation, from $24,820 in 2016-17 to $25,620 in 2017-18.
- Average published in-district tuition and fees at public two-year colleges increased by 2.9% before adjusting for inflation, from $3,470 in 2016-17 to $3,570 in 2017-18.
- In 2017-18, full-time students at public two-year colleges receive an average of about $3,900 in grant aid and federal education tax credits and deductions—$330 more than required to cover tuition and fees. On average, after grant aid, they must cover about $8,070 in living expenses.
- In 2017-18, average published in-district tuition and fees for full-time students at public two-year institutions range from $1,430 in California and $1,760 in New Mexico to $6,840 in New Hampshire and $7,980 in Vermont. Average tuition and fees for in-state students at public four-year institutions range from $5,220 in Wyoming and $6,360 in Florida to $16,040 in Vermont and $16,070 in New Hampshire.
- Average published tuition and fees at private nonprofit four-year institutions increased by 3.6% before adjusting for inflation, from $33,520 in 2016-17 to $34,740 in 2017-18.
- The increase in average grant aid and tax benefits for full-time students at private nonprofit institutions was large enough to lower average net tuition and fees by $740 (in 2017 dollars) between 2007-08 and 2017-18, but most of the increase in aid came during the first half of the decade.
- Between 2007-08 and 2017-18, average tuition and fees increased by $870 (in 2017 dollars) at public two-year colleges, $2,690 at public four-year institutions, and $7,220 in the private nonprofit four-year sector. 3 2017 Trends in Higher Education
- Between 2005-06 and 2010-11, total state and local funding rose by 2%, from $75.6 billion (in 2015 dollars) to $77.3 billion. At the same time, enrollment increased by 19%, generating a 14% decline in per-student funding over these five years. Between 2010-11 and 2015-16, total funding fell by 2%. Combined with a 5% decline in enrollment, this generated a 3% increase in per-student funding over these five years.
- Between 2004-05 and 2014-15, per-student revenue at public four-year institutions from tuition and fees and federal, state, and local governments increased by $720 (3%) in 2014 dollars. Net tuition revenue increased by $3,000,while revenue from government sources declined by $2,280.
- Tuition and fees constitute 39% of the total budget for in-state students living on campus at public four-year colleges and universities and 20% of the budget for public two-year college students who pay for off-campus housing.
Key Student Aid Findings
- In 2016-17, undergraduates received an average of $14,400 per FTE student in financial aid, including $8,440 in grants from all sources, $4,620 in federal loans, $1,280 in education tax credits and deductions, and $60 in Federal Work-Study.
- Grant aid per FTE undergraduate student increased by $1,020 (14%) in 2016 dollars between 2011-12 and 2016-17, after increasing by $2,180 (42%) over the preceding five years.
- Total Pell Grant expenditures increased from $15.2 billion (in 2016 dollars) in 2006-07 to $35.8 billion in 2011-12, but declined to $26.6 billion by 2016-17. The number of Pell Grant recipients declined in 2016-17 for the fifthconsecutive year, but the 7.1 million recipients represented a 38% increase from 5.2 million a decade earlier.
- Colleges and universities increased their aid by 32%, from $44.4 billion (in 2016 dollars) in 2011-12 to $58.7 billion in 2016-17. Over these five years, federal grant aid declined by 15%, and grant aid from states and from employers and other private sources rose by less than 10%.
- Annual education borrowing fell (in inflation-adjusted dollars) in 2016-17 for the sixth consecutive year. Federal education loans per FTE undergraduate student followed the same pattern, but the average amount borrowed by graduate students increased for the second year in a row—to $17,710, almost four times as high as the $4,620 in federal loans per undergraduate student.
- Undergraduate students and parents borrowed 2% more (after adjusting for inflation) in 2016-17 than in 2006-07, but 18% less than in 2011-12. Graduate students borrowed 31% more in 2016-17 than in 2006-07, but 3% less than in 2011-12.
- Total federal loans per FTE undergraduate student increased by 36% ($1,470) between 2006-07 and 2011-12, but declined by 17% ($970) between 2011-12 and 2016-17. • In 2015-16, the 60% of bachelor’s degree recipients from public and private nonprofit institutions who borrowed graduated with an average of $28,400 in debt. 4 2017 Trends in Higher Education
- Sixty percent of federal student loan borrowers entering repayment in 2010-11 and 2011-12 after earning a degree or certificate and 34% of noncompleters had paid down at least $1 of loan principal after three years. Repayment rates ranged from 23% for independent students in the for-profit sector to 68% for dependent students in the private nonprofit sector.
- In 2017, 50% of the outstanding federal education loan debt is held by the 12% of borrowers owing $60,000 or more; 57% percent of borrowers with outstanding federal education loan debt owe less than $20,000.
- The share of the savings from education tax credits and deductions going to households with adjusted gross income (AGI) below $25,000 rose from 15% in 2004 to 24% in 2014. The share going to those with AGI over $100,000 rose from 0% to 24%.
The Trends in Higher Education series provides insight into trends in college pricing and financial aid. A college education is critical to one’s long-term financial security, yet many students and families face real financial barriers to college enrollment and success. The data on college prices and student aid included in these reports create a context for evaluating public policies designed to increase educational opportunities. For more information about the College Board’s work, please visit collegeboard.org.
https://www.collegeboard.org/releases/2017/students-families-pay-more-out-of-pocket